AI assistance inside the debugging workflow.
Android engineers use the Android Bug Tool (ABT) to make sense of dense logs and bug reports. In this project, I explored how ML and generative AI could help engineers find signals, interpret events, and investigate problems while staying in the tools they already use.
Less searching
Surface potentially relevant log lines earlier in triage.
Better understanding
Make complex logs easier to read, explain, and visualize.
Human judgment
Keep developers in control of investigation and interpretation.
Made AI useful within the Android debugging workflow.
I worked across engineering, research, product, and design to translate developer problems and emerging AI capabilities into a connected, reviewable product experience.
Mapped the debugging journey
I reviewed existing ABT workflows and information architecture, identified friction during early triage, and synthesized developer insights with research partners.
Defined where AI should intervene
I translated pain points into interaction opportunities for log highlighting, inline explanation, contextual investigation, and temporal visualization.
Designed connected interaction patterns
I created micro- and macro-interactions that link AI output to selected logs, bug context, follow-up actions, and developer verification.
Made the direction tangible
I produced high-fidelity UI and end-to-end prototypes, collaborated with Android engineers and UX researchers on test scenarios, and iterated on the experience using feedback.
My role was AI / ML UX Designer. These contributions describe design and research collaboration; ML model development was a cross-functional responsibility.
Debugging started with too much information and too little direction.
During initial triage, engineers moved between raw logs, bug reports, and AI tools. Identifying the right signals required manual scanning, technical knowledge, and repeated context switching.
Signal overload
Important log events competed with thousands of low-value entries.
Fragmented tools
AI assistance was not consistently embedded in the debugging workflow.
Interpretation cost
Even when engineers found a log, understanding it could require more investigation.
How might AI reduce debugging effort while preserving context and developer judgment?
Understand how engineers investigate bugs before adding AI.
Working with Android engineers, UX researchers, and product partners, I examined early triage, developer workflow friction, existing AI experiments, and the information architecture of ABT.
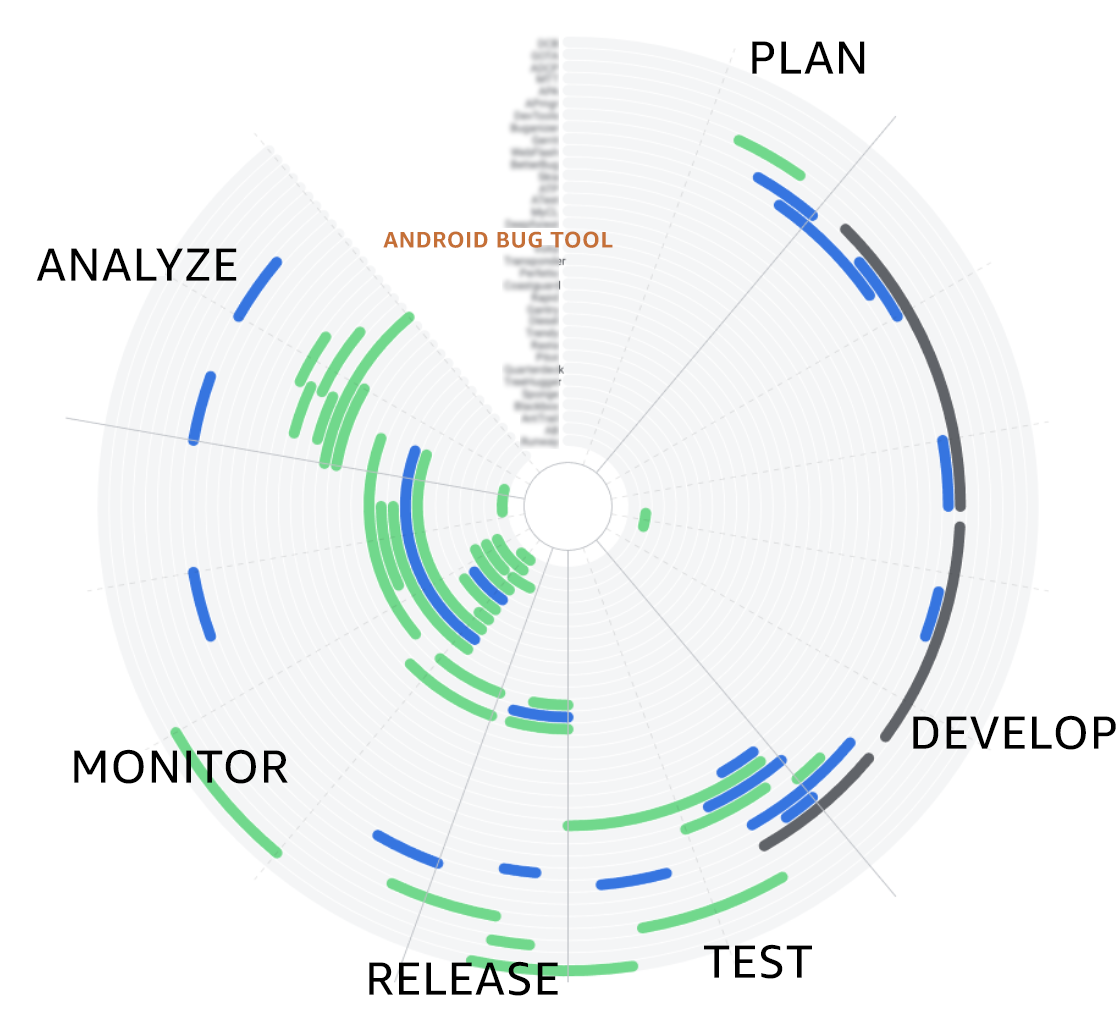
Research highlighted repeated log scanning, uncertainty in early triage, and difficulty connecting AI explanations to the bug currently under investigation.
- Relevant log signals needed to be more discoverable.
- Explanations needed to stay connected to the selected log and bug.
- Existing ABT navigation and developer mental models needed to be respected.
- AI output needed to remain inspectable rather than authoritative.
Before and after the proposed interaction model
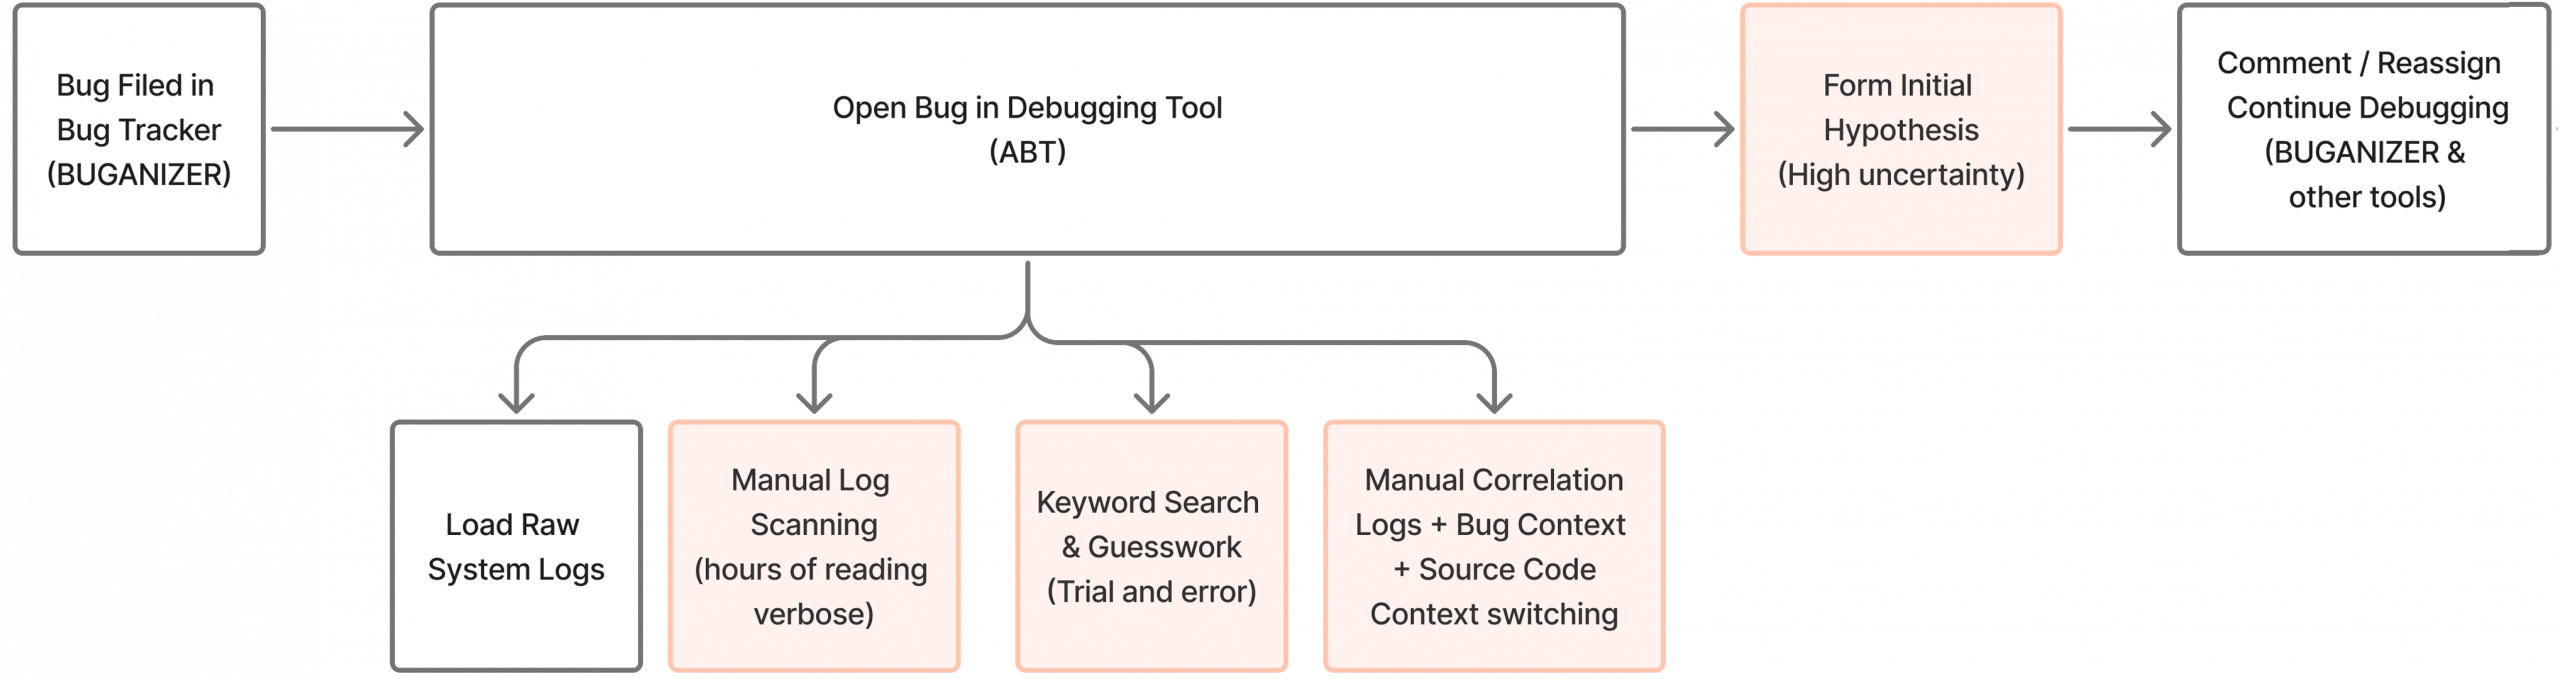
Searching and correlating raw log entries depended heavily on manual investigation.
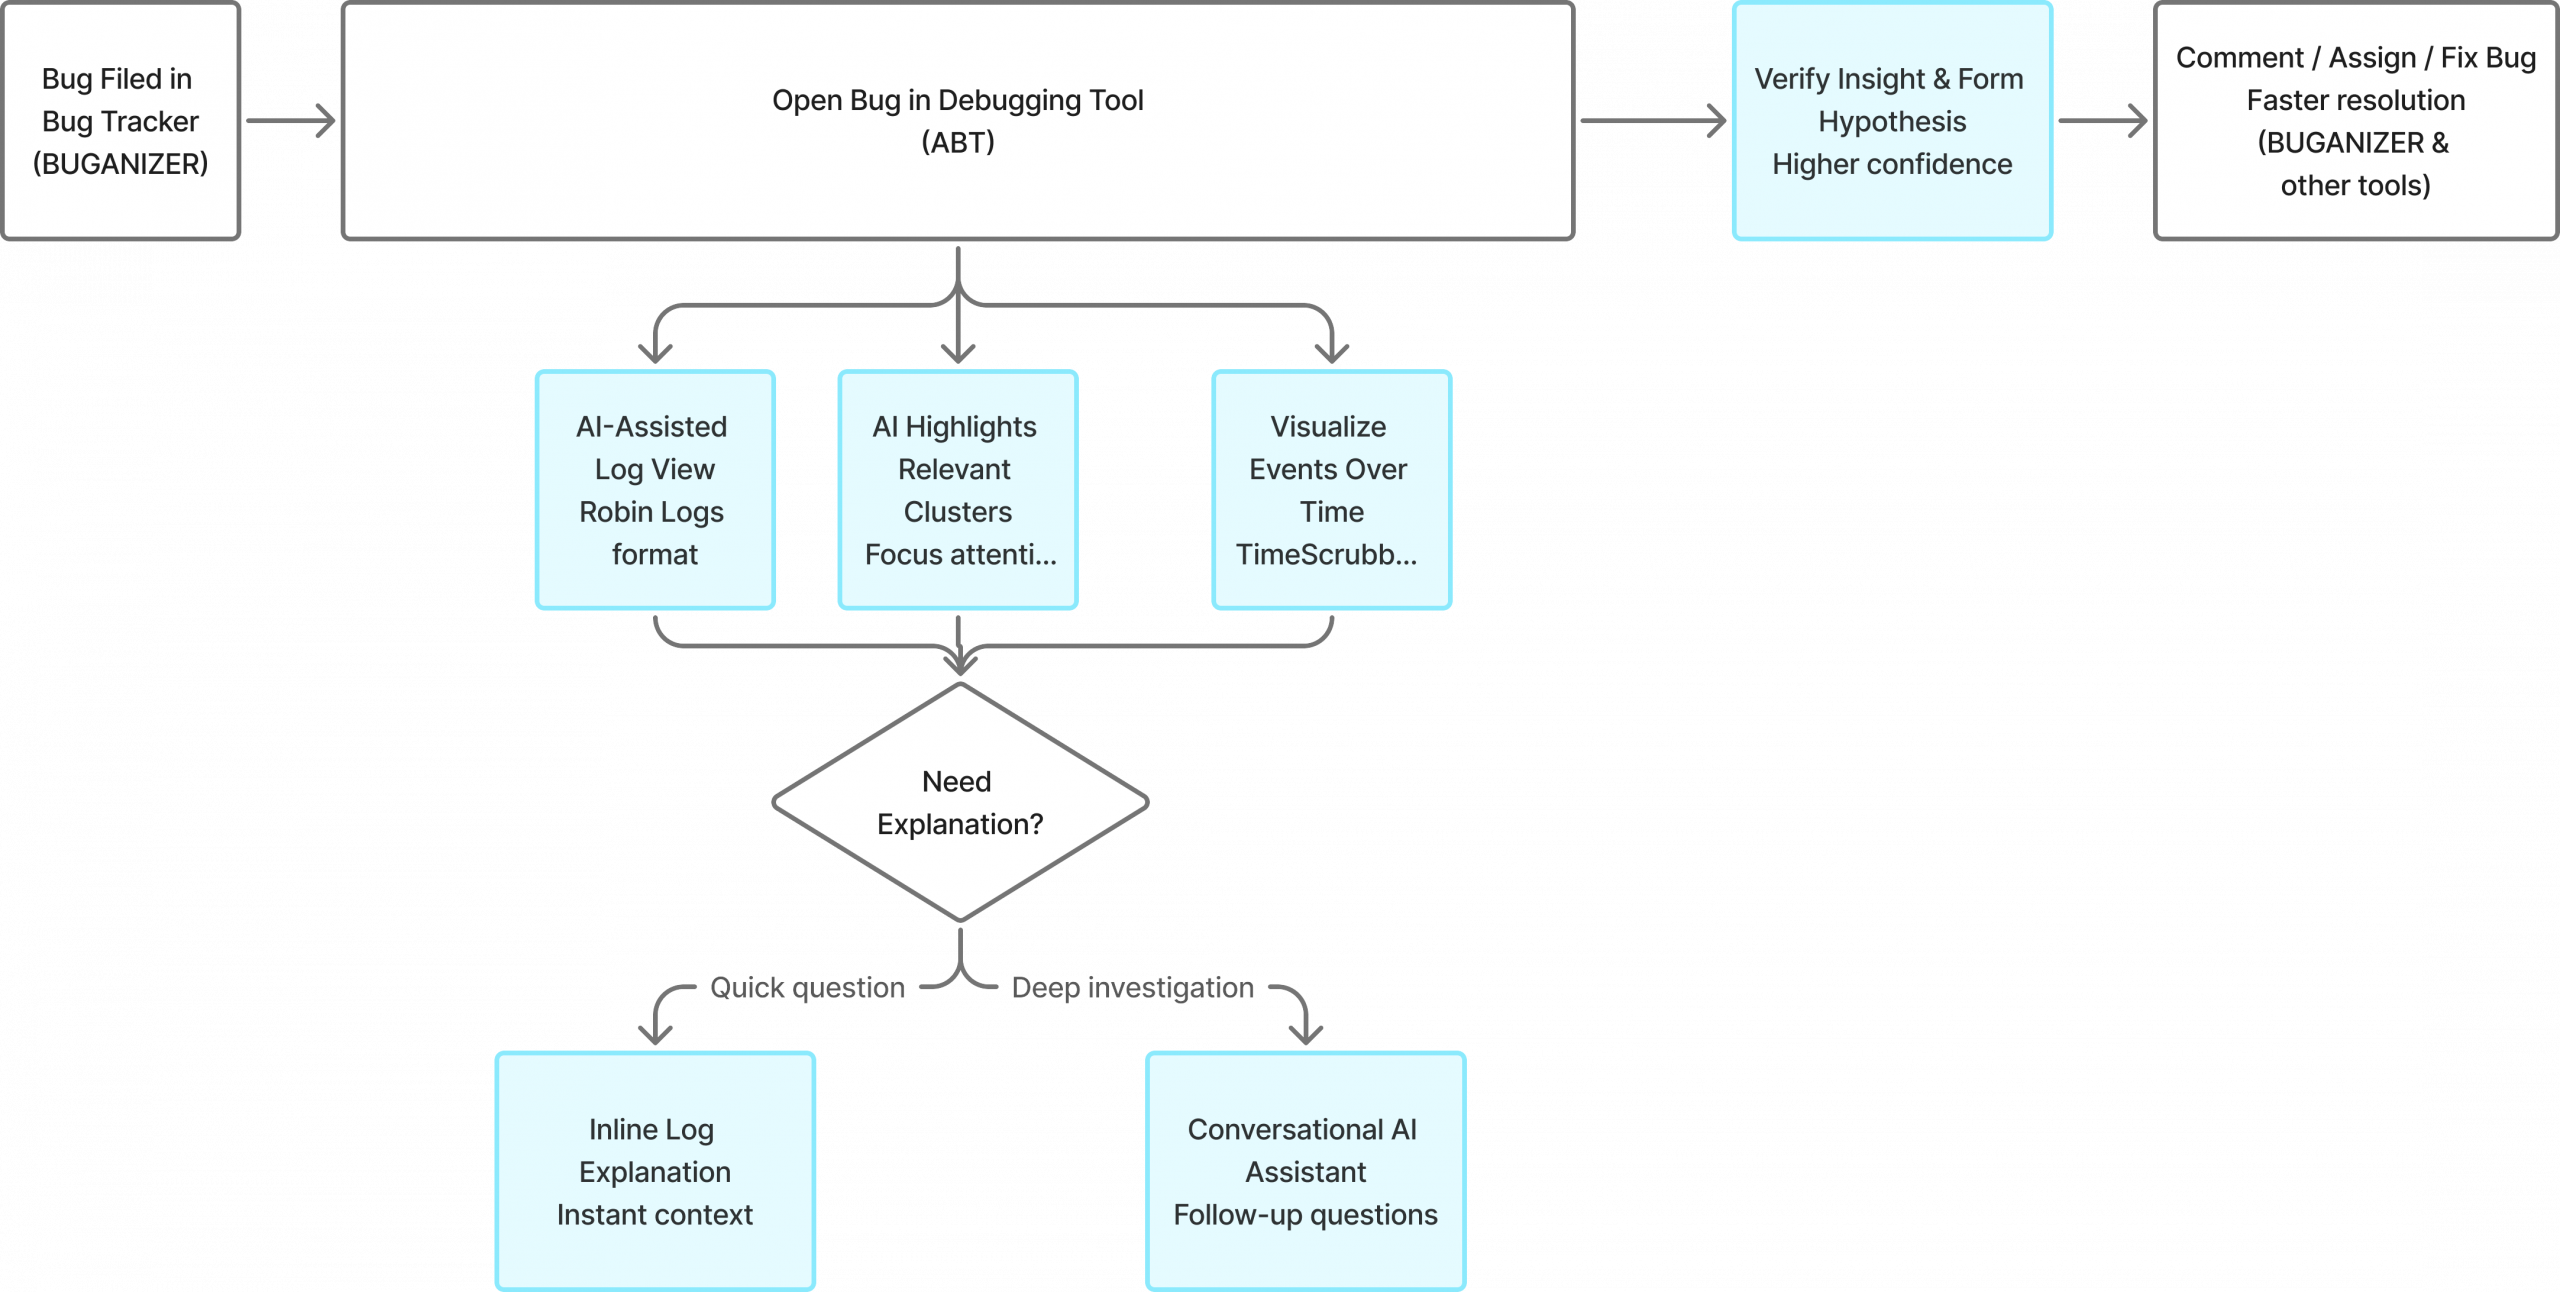
AI helps surface relevant signals and explain them within the existing workflow.
IA Review · Map where assistance belongs
I mapped ABT’s existing information architecture against the end-to-end debugging journey to identify intervention points without creating a disconnected AI destination.
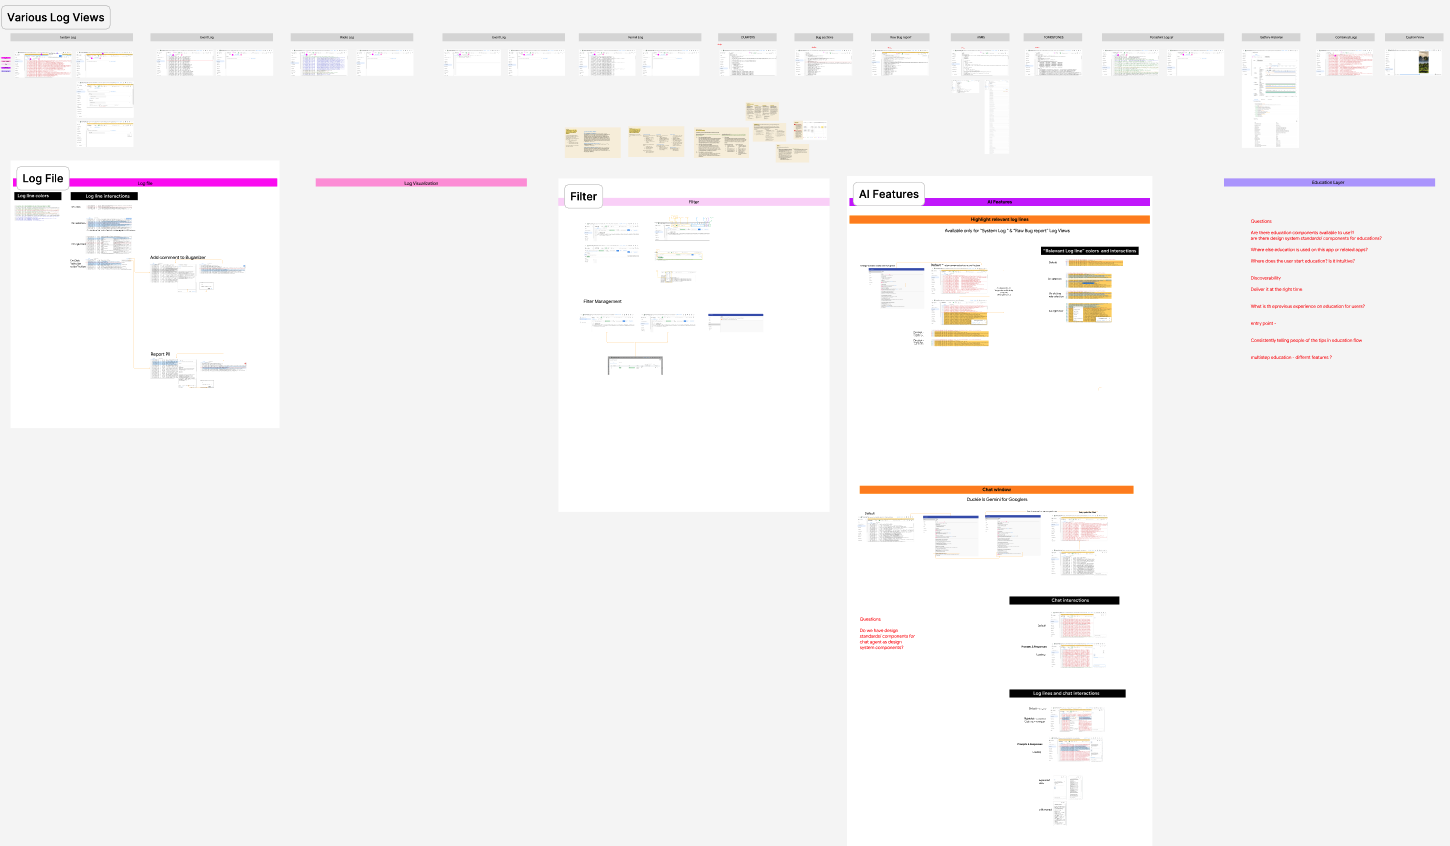
Turn the research into a connected AI experience.
Rather than introduce AI as a separate destination, I designed assistance around meaningful moments in the existing debugging journey—from triage to explanation to investigation.
From a raw log to an informed next step.
I designed five connected interaction patterns to support investigation without turning debugging into a separate AI chat experience.
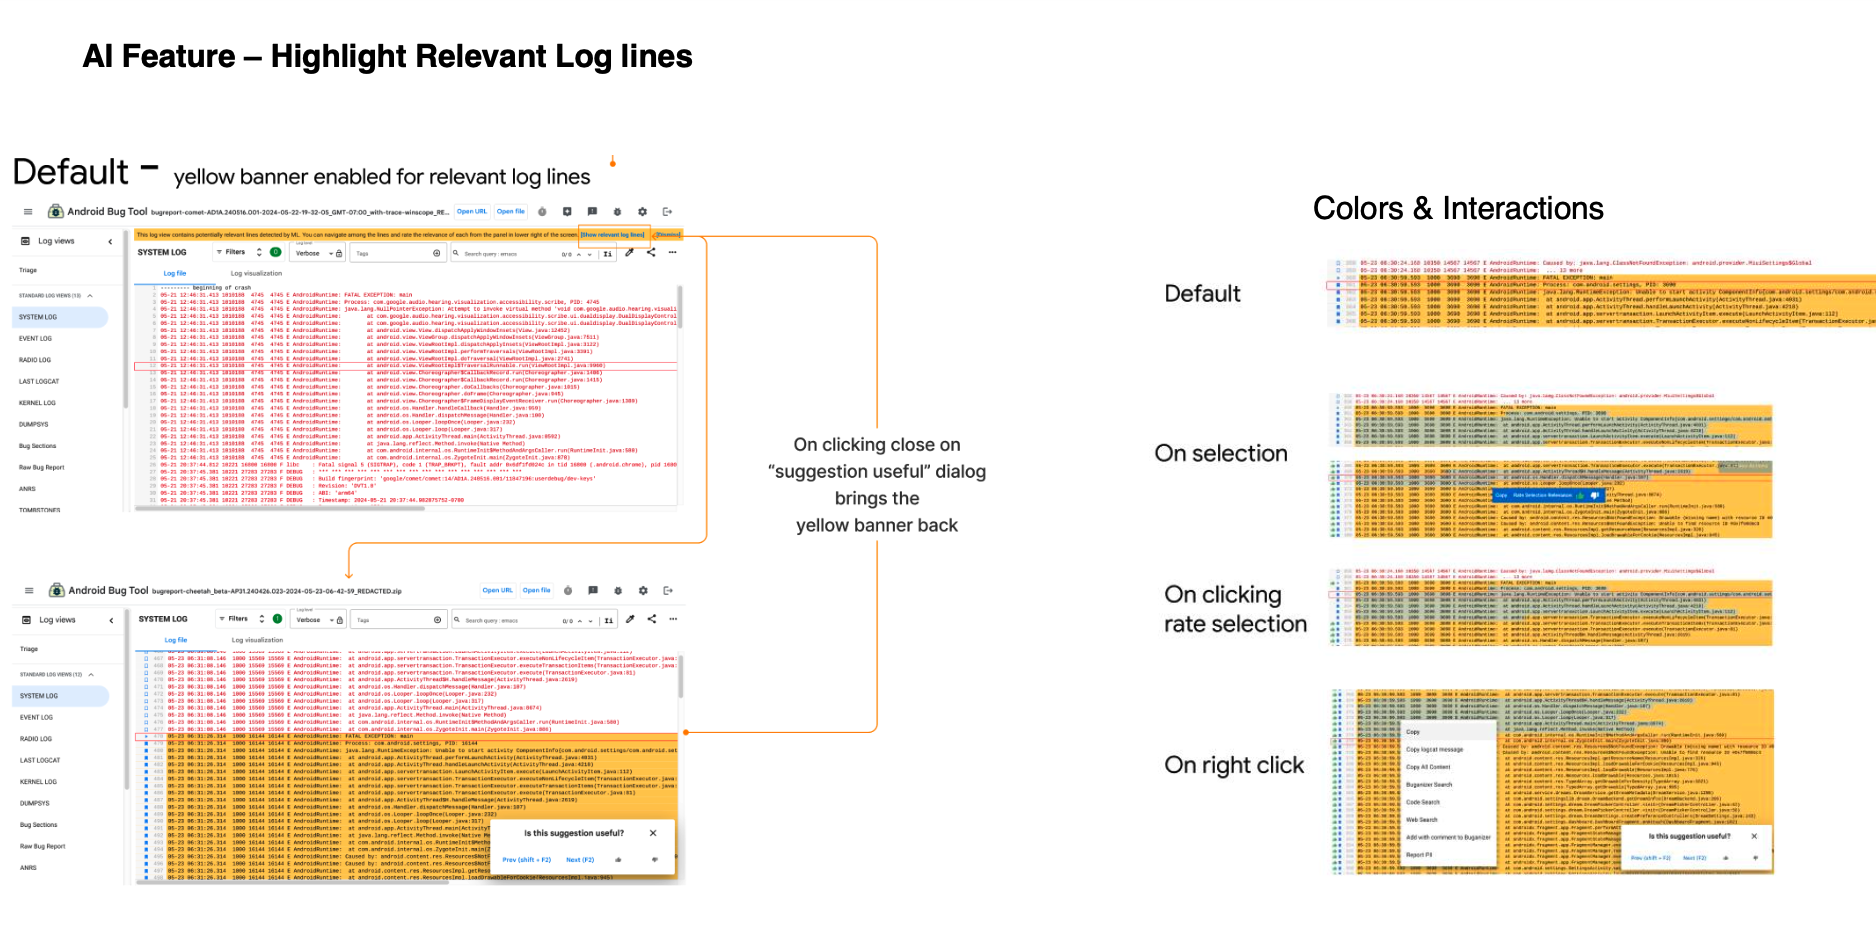
Highlight Relevant Logs
Surface potentially meaningful entries and help engineers identify an initial hypothesis. Highlighting creates a starting point, while the full log context remains available.
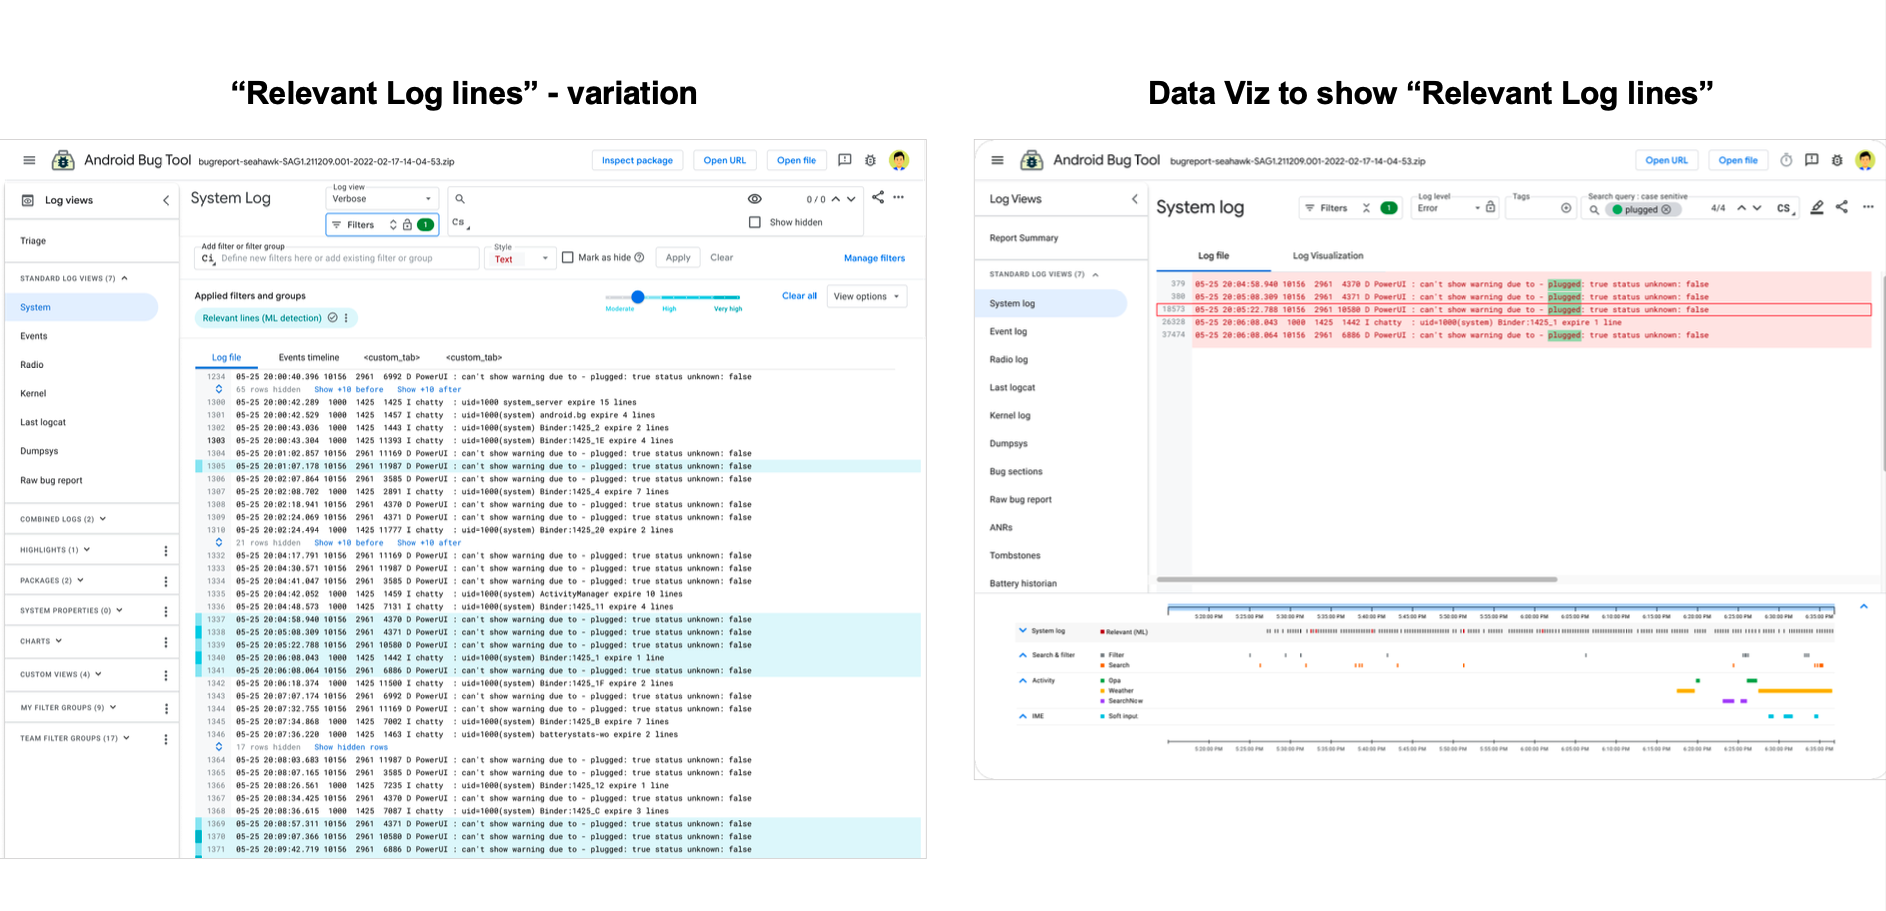
TimeScrubber: recognize patterns across time
Use temporal visualization to reduce repeated manual scanning and make event sequences easier to compare during investigation.
Replace “Where in these thousands of lines did something happen?” with an overview that helps engineers find and inspect relevant time windows.
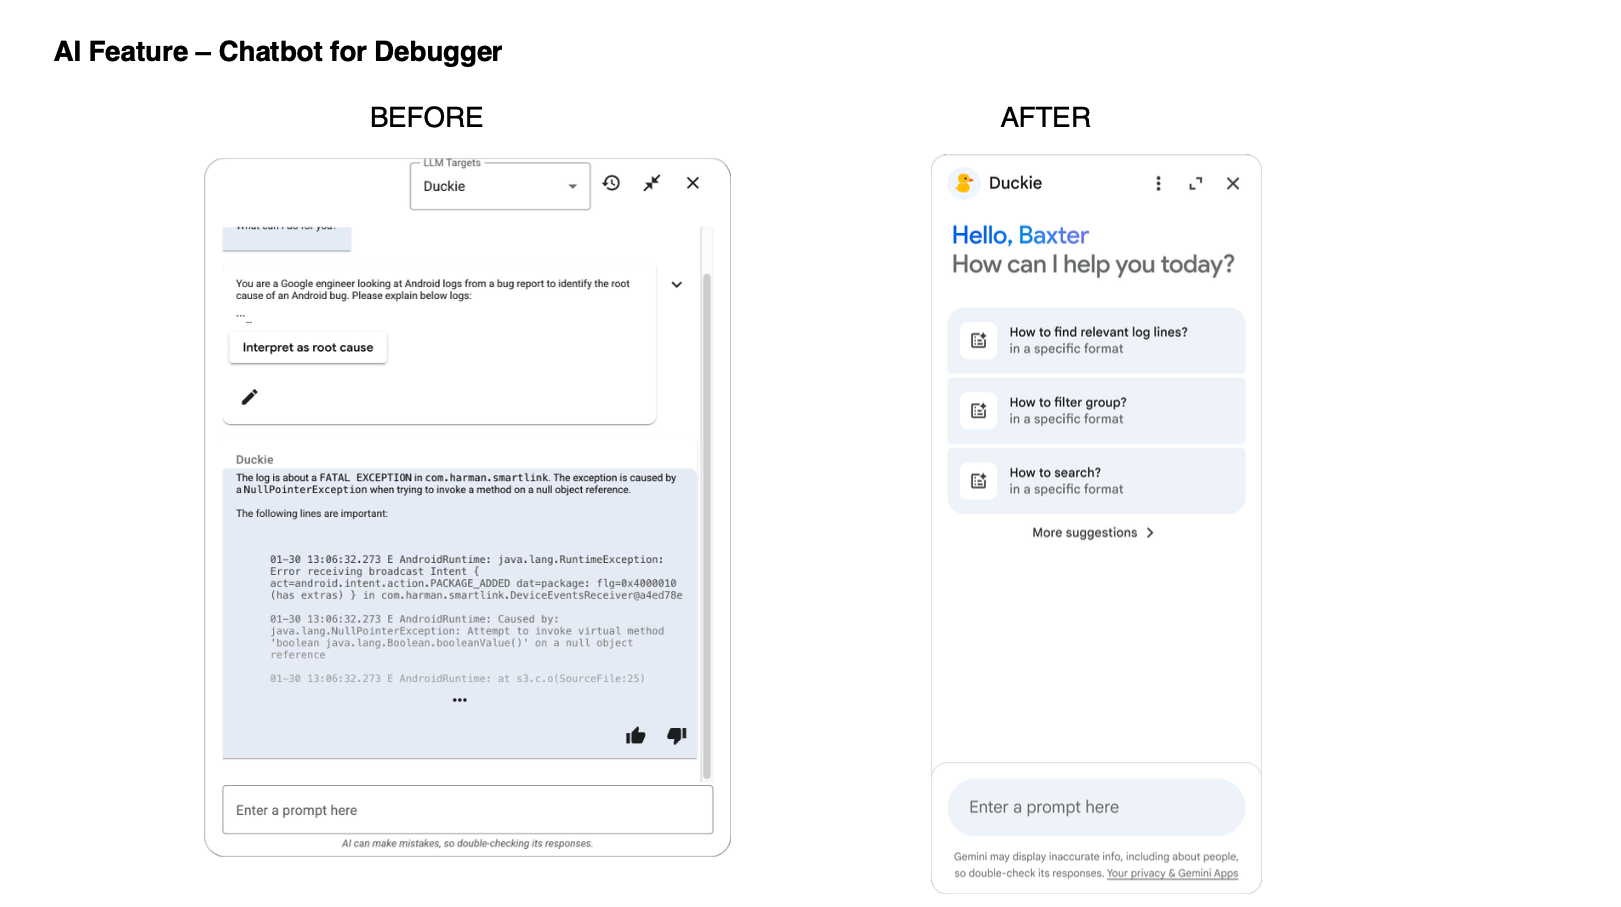
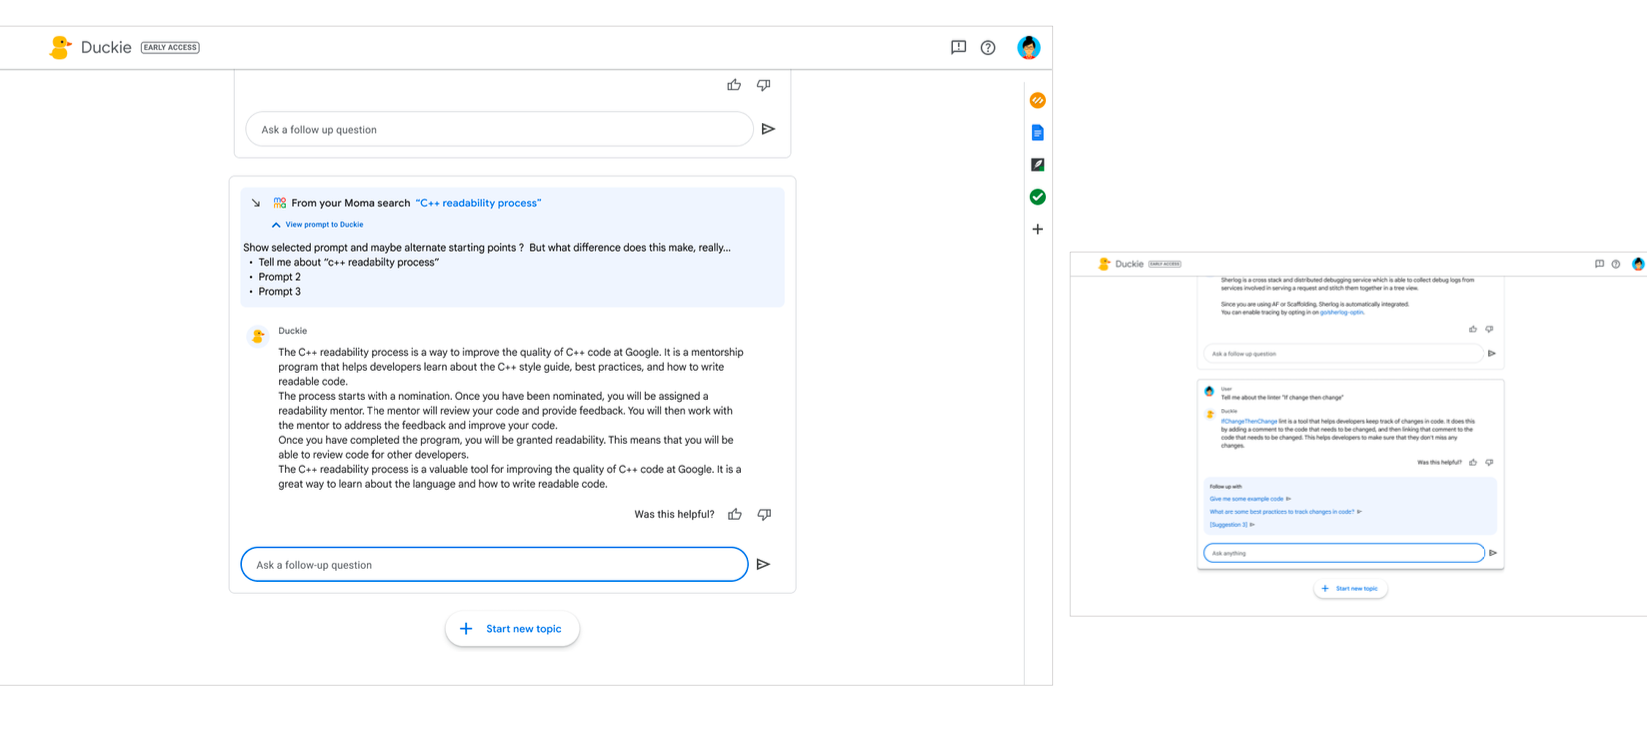
Explain inline. Investigate conversationally.
Inline explanations provide fast clarification on a selected log. A contextual assistant supports deeper follow-up without asking the engineer to reconstruct the bug context in a separate tool.
Explain
Plain-language summaries and relevance reasoning.
Connect
Trace explanations back to log lines and debugging context.
Control
Give engineers room to verify, question, or disregard AI suggestions.
Robin Logs: make raw output easier to scan
Explore a more structured, intelligible log format with clearer groupings and supporting labels, including sensitive AI-related debugging flows.
Bring AI into the ABT landing experience
Make AI-assisted affordances discoverable at the points where engineers open a bug and begin triage, rather than hiding assistance behind an experimental setting.
From manual discovery to assisted sensemaking.
I designed a context-aware debugging experience that connects ML-driven assistance, visual cognition, and developer workflows. Through Robin Logs and TimeScrubber, I explored patterns for moving from manual log discovery toward assisted sensemaking within the Android ecosystem.
| Metric | Before | After* | Why it changed · Design rationale |
|---|---|---|---|
| Debugging Time | ~3 hrs | ~1.5 hrs (↓ ~50%) | Relevance highlighting and log visualization (TimeScrubber) reduced time spent searching and orienting during early triage. |
| Log Relevance Accuracy | ~61% | 89% (↑ ~1.45×) | Robin Logs and AI-ranked log highlighting focused attention on high-signal log clusters without hiding raw data. |
| Developer Trust in AI | Low | High (↑ ~2.4×) | Visible reasoning, inline explanations, and explicit feedback loops made AI behavior inspectable and verifiable. |
| Feedback Completion | n/a | ~80% | Lightweight, in-context feedback UI lowered friction and supported trust calibration rather than passive consumption. |
*Directional indicators: Figures are based on internal prototype testing, validation sessions, and developer feedback, rather than measured production outcomes. Developer trust is a qualitative rating; the quoted ~2.4× change needs a defined numeric scale before it can be reported as a measured uplift.
What I learned about designing AI for developers.
This project changed how I decide where AI belongs, what evidence it should show, and how to evaluate its value.
Design around the investigation
A separate AI destination adds friction. I now map the developer’s decision point before deciding where AI should appear.
Make evidence inspectable
Explanations are not proof. I now connect AI output to source logs so engineers can verify or reject suggestions.
Visualize to investigate
TimeScrubber showed me that timelines should help developers test hypotheses, not just simplify large volumes of logs.
Measure before claiming impact
Prototype feedback is not production evidence. I would define success measures earlier: signal discovery, explanation accuracy, and verification behavior.